HDG #013: Dashboards have requirements too
Read time: 2 minutes
Greetings, Gurus! Today we’re talking about one of the most overlooked concepts in analytics—requirements. If you’ve worked in software at all, you are either very familiar with requirements or you are very familiar with the Devs telling you that the so-called requirements you did provide suck.
Well, newsflash my Gurus. Dashboards have requirements too.
It goes without saying that data visualization is sexy (heh). But its not-so-sexy underpinnings — like research, planning, requirements gathering, documentation, testing, and other important steps — are often overlooked in development.
“I am the worst offender of this one.” — Me, just now. Also last year, and the entire decade before that.
The fact is: this results in dashboards looking as though they were designed for rocket scientists by rocket scientists, dashboards that no one ends up using, and/or dashboards that just leave the user asking for an Excel data extract to do their own thing, anyway.
These underpinnings are standard operating procedure in the age-old software development life cycle (SDLC), but data practitioners in our field don’t always follow this rigor when creating dashboards and analyses, despite having many similar steps and goals as software or product development.
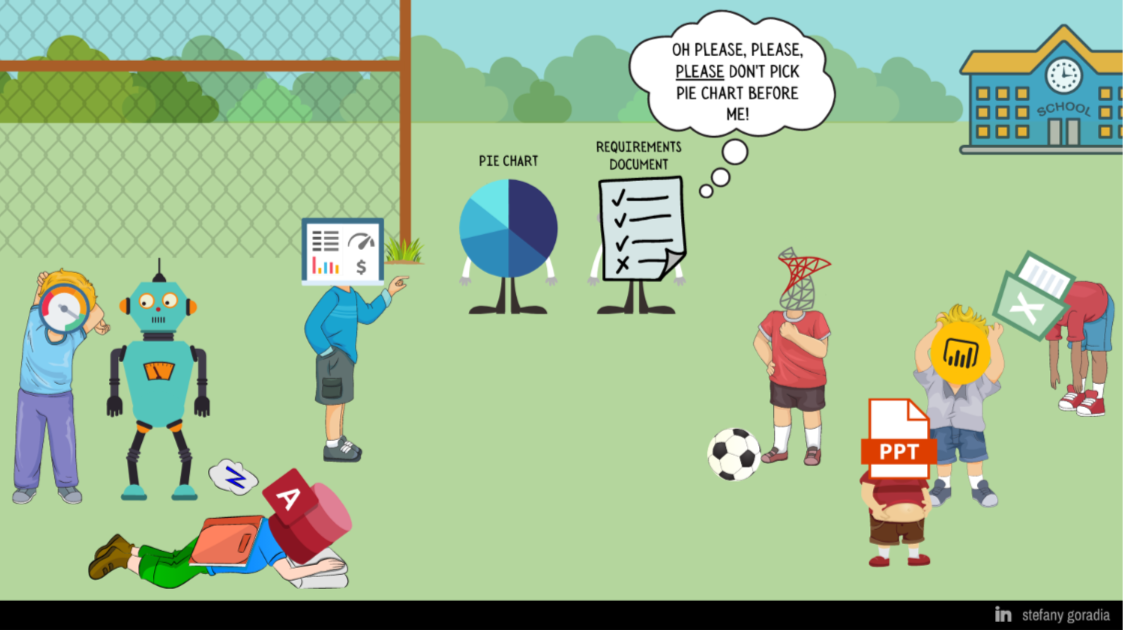
In fact, requirements and documentation are often picked last— if at all.
The data field can be a cruel place.This image was inspired from [a hilarious original cartoon by Paul Noth](<https://twitter.com/PaulNoth/status/1192525941987299330?s=20>).
While formal Requirements Documents might not seem relevant if you’re not a software or product developer, I’ve seen the result of overlooking these steps lead to a range of consequences analytics:
business users not using your dashboard over the long haul (or claiming it doesn’t have the information that they need),
an increased number of questions from users when assumptions and definitions aren’t well-documented, let alone recalled by the builder when asked about it 3 months later,
and inconsistent definitions of metrics/values lead to incongruence between data sources and more trust fail, which accumulates trust debt over time and becomes harder and harder to recover from (even if I did make up the term “trust debt” just now)
But this is all easier said than done when exact steps can be hard to list. Overlapping concepts all sound slightly similar (yet all mean something slightly different) and add more complexity to the requirements and design mix. We can start by learning about concepts like:
software development life cycle (SDLC),
systems engineering or systems development life cycle (also called SDLC),
technical requirements document (TRD),
business technical requirements document (BTRD),
user research and/or discovery,
functional requirements, non-functional requirements, system requirements, all the requirements
A starter process could be kludged together from a few of these. I haven’t yet seen an industry-standard methodology specific to building data dashboards that is as widely cited as disciplines like software development or systems engineering, though a few are attempting to emerge.
The so-called data analytics life cycle consists of 6 steps: discovery, data prep, model design, model build, communicating results, and operationalizing (put into production). Others have proposed an 8+ step dashboard development life cycle, which seems too many to list in a simple sentence.
With time, something may crop up as a widely-accepted data/dashboard life cycle methodology, but you’ll be ahead of the curve if you start thinking about this as a formal process, and maybe even start implementing something along these lines now.
. . .
Actionable Idea of the Week:
For now, I urge you to put some of these concepts into practice.
If you’re a data or dashboard requestor, think about what the real requirements are. What questions do you want or need to be answered? What are the inclusions/exclusions? What kind of definitions need to be used?
In many cases, your analyst can help define these with you, but it will immensely help if you come to the table with some ideas here already.
If you’re an analyst, think about what kinds of things have led to your dashboards’ lack of adoption in the past. What kinds of questions (requirements) can you ask or define upfront with your stakeholder to avoid that?
Still not sure where to start? I started here:
this Analytics Data Dictionary Template to help you start documenting, culling, and organizing your KPIs now — provided by BI Brainz,
this overview of the different styles of requirement documents that you might want to consider considering — posted by Dip Bagchi, and
this less-fun but still informative article about 9 different types of requirements documents (more from a software perspective)
. . .
And if there is another methodology out there that we should all spend time learning about, hit reply to let me know and help spread the word among your fellow gurus!
See you next week!
-Stefany


